
Velvet Realty Group Blog
Northeast Corridor Price-Band Comparison, September 2026
Universal City, Schertz, Cibolo and Live Oak, measured the same way: September 2026 asking prices by ZIP Code, owner-estimated value bands by city, and what closed-sale data covers. Figures downloaded October 11, 2026.
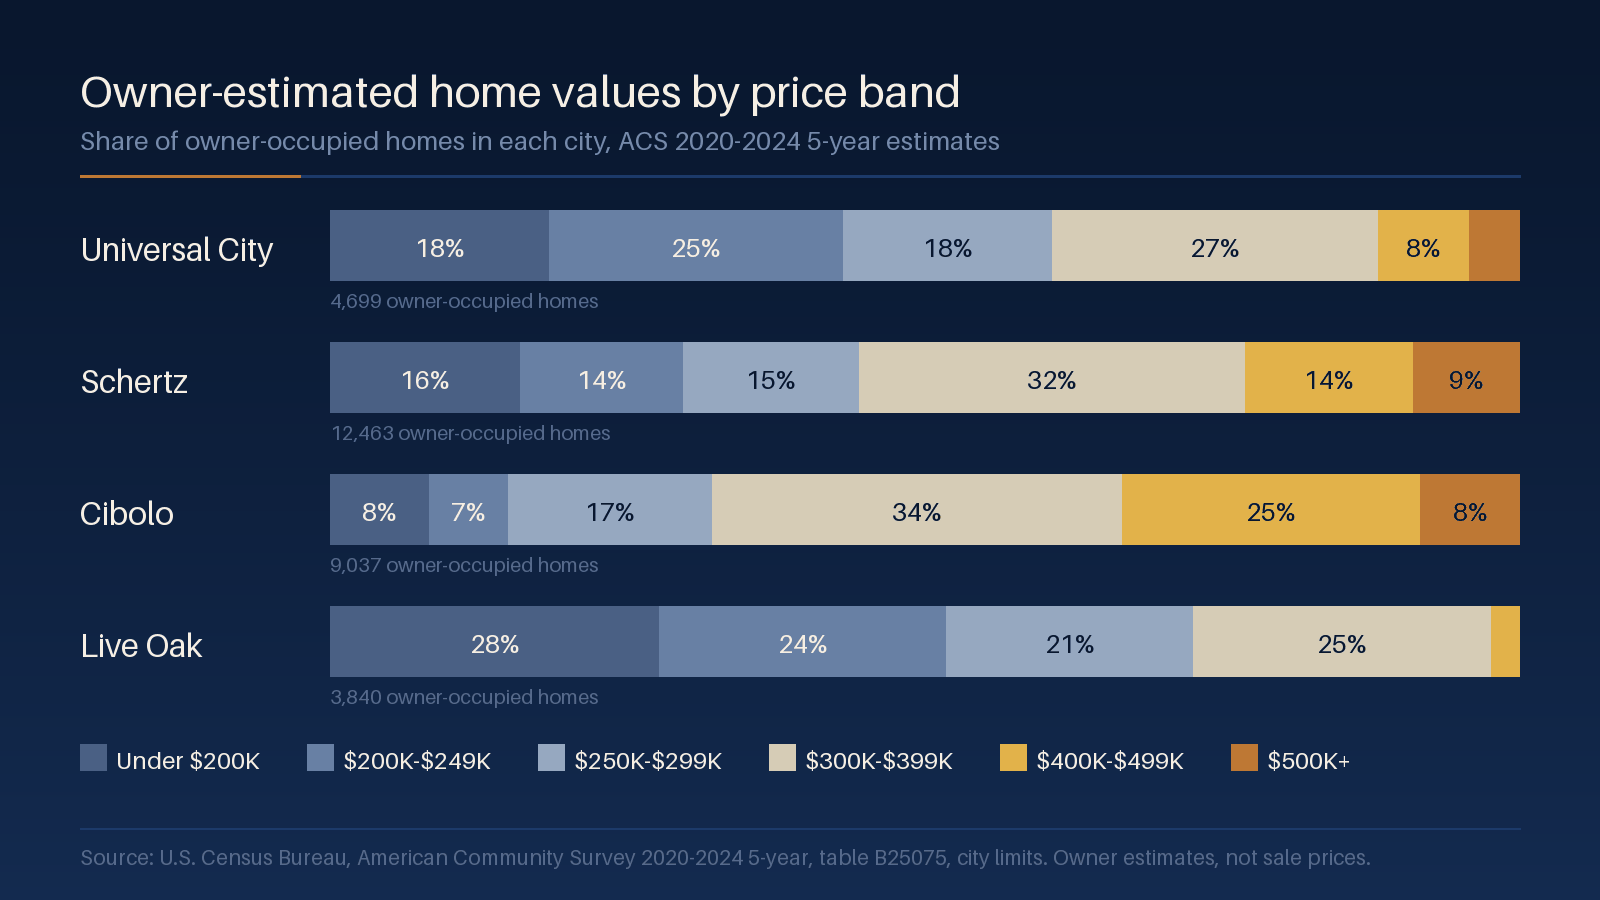
The short version. In September 2026 the median asking price on homes for sale was $350,000 in Schertz's ZIP 78154 and $347,000 in Cibolo's 78108. It was $285,000 in Universal City's 78148 and $243,427 in 78233, the ZIP that holds Live Oak. In the Census Bureau's 2020–2024 survey, the most common value band for owner-occupied homes was $300,000 to $399,999 in Cibolo and Schertz. In Live Oak, about half of owner-occupied homes were valued under $250,000. These are asking prices and owners' own estimates. Neither one is a sale price.
This page puts the four cities of the northeast corridor through the same method: the same sources, the same month, and the same definitions. It is for a buyer or seller comparing Universal City, Schertz, Cibolo and Live Oak before narrowing to one. It does not rank the cities or forecast prices. Every figure below was downloaded on October 11, 2026, and each table says which month it describes.
Three kinds of price number, kept apart
A price band is a range of prices, such as $300,000 to $399,999. The question is always which prices fall in it. This page uses three kinds, and they answer different questions:
| Figure | What it measures | Geography | Period |
|---|---|---|---|
| Asking prices | Prices on homes listed for sale (active listings), from Realtor.com's monthly ZIP Code file | ZIP Code | September 2026 |
| Owner estimates | What owners told the Census Bureau their home would sell for, grouped into value bands | City limits | 2020–2024 survey responses, pooled |
| Closed sales | Prices on completed sales reported through the MLS, from the San Antonio Board of REALTORS (SABOR) | San Antonio area and Bexar County only | September 2026 |
A few terms used below:
- Active listing: a home for sale and not yet under contract. Realtor.com counts how many are active on a typical day of the month.
- Pending listing: a home under contract that has not closed.
- Pending ratio: pending listings divided by active listings. A ratio of 0.25 means about 25 homes under contract for every 100 still for sale.
- Median: the middle value when every price is lined up from low to high. Half are above it and half below.
- ZIP Code versus city: a ZIP Code is a mail delivery area, not a city boundary. How well each ZIP stands in for its city is covered further down.
The asking band in September 2026
Here are the four ZIP Codes, one row each, from the same monthly file. Each column is a separately published figure for that ZIP and month. The median price, the price per square foot and the median size are calculated separately, so one does not explain another.
| ZIP Code | Median asking price | Average asking price | Asking price per sq ft (median) | Median size | Active listings | Pending listings | New listings that month |
|---|---|---|---|---|---|---|---|
| 78154 Schertz | $350,000 | $406,522 | $164 | 2,338 sq ft | 228 | 58 | 42 |
| 78108 Cibolo | $347,000 | $357,702 | $148 | 2,358 sq ft | 361 | 94 | 90 |
| 78148 Universal City | $285,000 | $300,875 | $147 | 1,950 sq ft | 94 | 19 | 22 |
| 78233 Live Oak and northeast San Antonio | $243,427 | $259,721 | $150 | 1,627 sq ft | 171 | 50 | 40 |
Three things stand out.
- Schertz and Cibolo ask almost the same median price, for different reasons. Their medians are $3,000 apart and their median sizes are 20 square feet apart. But Schertz asks $164 per square foot against Cibolo's $148. Schertz's average asking price, $406,522, is also far above its median. That gap means a set of higher-priced listings pulls the average up in 78154 more than in the other three ZIPs.
- Cibolo has the most homes for sale. 361 active listings, more than Universal City and 78233 combined, and 90 new listings in the month.
- 78233 asks the least overall but not the least per foot. Its $150 per square foot is above Cibolo's and Universal City's. Its homes are smaller at the median, 1,627 square feet.
What changed from September 2025
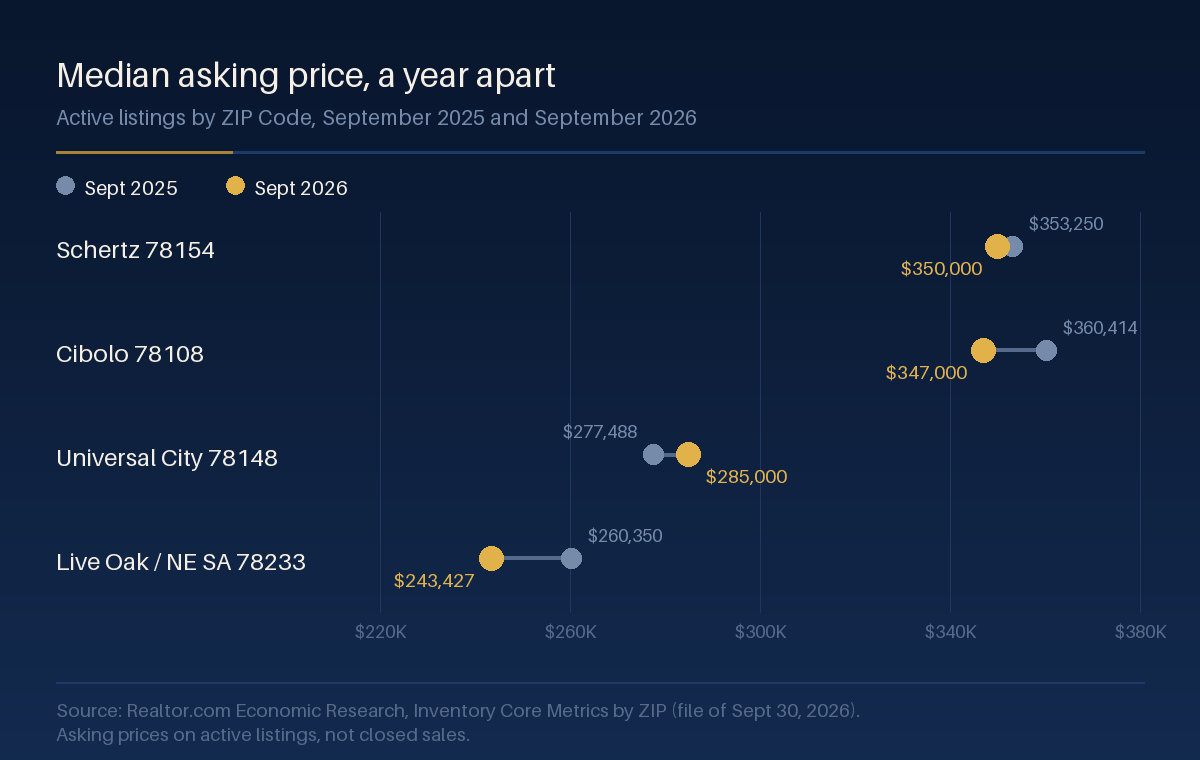
The same file carries every month back to July 2016. This table compares September with September, so seasonal swings do not distort it. Changes are our own arithmetic on the two rows.
| ZIP Code | Median asking price, Sept 2025 | Median asking price, Sept 2026 | Change | Active listings, 2025 → 2026 | Pending listings, 2025 → 2026 |
|---|---|---|---|---|---|
| 78154 Schertz | $353,250 | $350,000 | −0.9% | 198 → 228 | 60 → 58 |
| 78108 Cibolo | $360,414 | $347,000 | −3.7% | 320 → 361 | 89 → 94 |
| 78148 Universal City | $277,488 | $285,000 | +2.7% | 68 → 94 | 22 → 19 |
| 78233 Live Oak and northeast San Antonio | $260,350 | $243,427 | −6.5% | 170 → 171 | 59 → 50 |
Universal City is the only one of the four where the median asking price rose. It is also where active listings grew fastest, from 68 to 94, while contracts fell from 22 to 19. One caution: the source marks Universal City's September 2025 row with its quality flag. Realtor.com sets that flag when values fall outside their typical range and says such figures should be reviewed before reporting. Read that ZIP's year-over-year change with that in mind.
How much of the inventory is going under contract
A count of homes for sale tells you what is available. The pending ratio tells you how much of it is being taken. All four ZIPs fell on this measure over the year, so every one of them had fewer contracts for each home on the market than a year earlier.
| ZIP Code | Pending ratio, Sept 2025 | Pending ratio, Sept 2026 | Median days on market | Listings with a price cut (count) | Price-reduced share (as published) |
|---|---|---|---|---|---|
| 78154 Schertz | 0.30 | 0.25 | 75 | 104 | 29.3% |
| 78108 Cibolo | 0.28 | 0.26 | 69 | 168 | 31.6% |
| 78148 Universal City | 0.33 | 0.20 | 66 | 52 | 38.1% |
| 78233 Live Oak and northeast San Antonio | 0.35 | 0.29 | 58 | 78 | 29.2% |
Universal City had the lowest pending ratio in September 2026: about 20 homes under contract for every 100 for sale. 78233 had the highest, about 29. The price-cut count and the price-reduced share are two separately published fields. The share is not the count divided by active listings, and the file does not say what it is measured against, so both are printed as published. Median days on market is one summary number for the month. It does not tell you how long any particular home has been listed.
The value bands of homes owners already hold
Asking prices describe the few hundred homes listed in one month. To compare the wider housing stock across the four cities, the Census Bureau's American Community Survey asks owners what their home would sell for if it were for sale. Table B25075 groups those answers into value bands for every city. The figures below pool survey responses from 2020 through 2024, the newest five-year release for cities this size. They are measured within city limits, not by ZIP Code.
| Value band | Universal City | Schertz | Cibolo | Live Oak |
|---|---|---|---|---|
| Under $200,000 | 18% ±5 | 16% ±3 | 8% ±3 | 28% ±7 |
| $200,000–$249,999 | 25% ±7 | 14% ±3 | 7% ±2 | 24% ±8 |
| $250,000–$299,999 | 18% ±5 | 15% ±3 | 17% ±4 | 21% ±6 |
| $300,000–$399,999 | 27% ±6 | 32% ±4 | 34% ±4 | 25% ±6 |
| $400,000–$499,999 | 8% ±2 | 14% ±2 | 25% ±4 | 2% ±2 |
| $500,000 or more | 4% ±2 | 9% ±2 | 8% ±2 | 0% ±1 |
| Owner-occupied homes counted | 4,699 ±473 | 12,463 ±703 | 9,037 ±504 | 3,840 ±481 |
| Median owner-estimated value | $269,600 ±$17,253 | $317,100 ±$9,783 | $351,900 ±$9,620 | $246,300 ±$15,307 |
Shares are rounded to whole percentages, so a column may not total exactly 100. The pattern:
- Cibolo's owned homes cluster higher. About a third fall in the $300,000–$399,999 band and a quarter in $400,000–$499,999. Only about 15% are under $250,000.
- Schertz has the widest spread. No single band holds more than about a third of its owned homes, and about 9% are valued at $500,000 or more, close to Cibolo's 8%. That spread fits the gap between its median and average asking prices above.
- Universal City and Live Oak hold more of their stock under $300,000. About 61% of Universal City's owned homes and nearly three quarters of Live Oak's are valued below $300,000. Live Oak shows almost nothing at $400,000 or more.
Two cautions. First, these are survey estimates with real margins of error. Live Oak and Universal City are smaller cities, so their shares carry wider margins, up to about 8 points. Do not read a gap of a few points as a real difference. Second, a value an owner reports is not an appraisal or a sale price. Most responses predate 2025, so this table describes the housing stock, not this month's market.
How well each ZIP Code stands in for its city
Monthly listing data is published by ZIP Code. No public monthly series we found covers these four cities by their city limits. So it helps to know how much of each ZIP is actually inside the city it is named for. The Census Bureau's 2020 relationship file measures the land two geographies share.
| ZIP Code | Share of land inside the named city | Largest other pieces |
|---|---|---|
| 78154 | 69.6% in Schertz | 15.3% in Selma; 13.3% inside no city |
| 78108 | 62.6% in Cibolo | 18.6% in Schertz; 18.5% inside no city |
| 78148 | 56.2% in Universal City | 39.4% in the Randolph AFB census-designated place |
| 78233 | 32.7% in Live Oak | 66.1% in San Antonio |
The weakest match is 78233. Two thirds of its land is in the City of San Antonio, so its listing figures describe northeast San Antonio as much as Live Oak. Live Oak itself has 94.1% of its land in 78233, which is why it is the closest ZIP available. In 78108, almost a fifth of the land is in Schertz, and in 78154 a share is in Selma. A home's mailing address does not settle its city, its tax rate or its school district. Our guides to Cibolo, Schertz, Universal City and Live Oak show how to check the city and taxing units for one address.
Closed sales: what is published, and what is not
Asking prices and owner estimates do not tell you what homes actually sold for. Closed-sale figures for the area come from SABOR's monthly release, which reports MLS sales data. Its September 2026 release, dated October 9, 2026, covers two geographies:
| Geography | Closed sales | Median price | Other figures |
|---|---|---|---|
| San Antonio area (all home sales) | 2,793 | $302,999 (down about 2%) | Average days on market 88; homes closed at 92.4% of original list price on average; 5.95 months of inventory |
| Bexar County (single-family) | 1,839 (up 6%) | $282,680 (down 4.8%) | 5.4 months of inventory |
Neither row isolates the northeast corridor. Cibolo's tax table runs through Guadalupe County, and Schertz spans Guadalupe, Comal and Bexar counties, so the Bexar County row does not cover all of either city. A closed-sale median for each of these four cities is not yet documented here: we found no free public release that reports one by city limits for September 2026. Closed sales for a specific street or subdivision are available through the MLS. A Texas agent can pull them for you within the MLS's rules, which is the comparison worth making before you price an offer or a listing.
What this comparison can and cannot tell you
- It is not a forecast. Nothing here predicts where prices go next. One month is one month, and the five-year survey describes the stock, not the trend.
- It is not a value for your home. A median summarizes a mix of homes. When the mix shifts toward smaller or older homes, the median moves even if no seller changed a price.
- It covers all property types the sources count. The Realtor.com file reports all listings in the ZIP together, and the Census table counts all owner-occupied homes. SABOR's Bexar County row is single-family only. None of the tables separate new construction from resale.
- Small numbers move a lot. Universal City had 19 homes under contract in September. A handful of contracts either way changes its pending ratio noticeably.
Using the bands, depending on which side you are on
If you are buying, start with the band your budget sits in, then look at where that band is most common. A $300,000–$399,999 budget lands in the most common owner-value band in Cibolo and Schertz. Under $250,000, Universal City and Live Oak hold a larger share of their owned homes in that range, and their ZIPs have the lower asking medians. Then check the pace: every one of these ZIPs had fewer contracts per listing than a year earlier, which affects how much room there is to negotiate. Our checklist for buying near JBSA Randolph covers what to verify on an address once you have a shortlist.
If you are selling, the useful comparison is the homes nearest yours in size, age and location, not the corridor median. A Schertz home at $164 a square foot and a Cibolo home at $148 a square foot can both sit at the same headline price. Our seller repair checklist covers repairs to weigh before you list.
For the San Antonio-wide picture, see our market update page, which tracks SABOR's weekly and monthly releases. For a single city, the area guides for Universal City, Schertz, Cibolo and Live Oak cover utilities, taxes and housing types. The Universal City housing snapshot follows 78148 in more detail.
Questions buyers and sellers ask
Which northeast corridor city has the lowest asking prices?
In September 2026, ZIP 78233, which holds Live Oak and part of northeast San Antonio, had the lowest median asking price of the four ZIPs at $243,427. Universal City's 78148 was next at $285,000. Per square foot, 78233 asked $150, above Cibolo's $148 and Universal City's $147.
Is a median asking price the same as what homes sell for?
No. A median asking price describes homes listed for sale in a month. Across the San Antonio area, SABOR reported that homes closing in September 2026 sold at an average of 92.4% of their original list price. Closed-sale prices for a specific street come from the MLS.
Why compare ZIP Codes instead of cities?
Monthly listing data is published by ZIP Code, and no public monthly series we found reports these four cities by city limits. Each ZIP only partly matches its city. ZIP 78233 is about one-third Live Oak and two-thirds San Antonio by land area, according to the Census Bureau's 2020 relationship file.
Where do owner-estimated home values come from?
From the Census Bureau's American Community Survey, which asks owners what their home would sell for if it were for sale. This page uses table B25075 from the 2020–2024 five-year estimates, measured within each city's limits. The figures are survey estimates with margins of error, not appraisals.
Sources
- Realtor.com Economic Research, Inventory Core Metrics by ZIP, history file (last modified September 30, 2026; rows for 202509 and 202609, ZIPs 78108, 78148, 78154 and 78233), and the data dictionary for active, pending, pending ratio, total listing and quality flag definitions. Downloaded 2026-10-11.
- U.S. Census Bureau, American Community Survey 2020–2024 5-year estimates, tables B25075 (Value) and B25077 (Median Value), read from the table-based summary files for places 4874408 (Universal City), 4866128 (Schertz), 4814920 (Cibolo) and 4843096 (Live Oak); 2024 ACS subject definitions for "Value." Downloaded 2026-10-11.
- U.S. Census Bureau, 2020 ZCTA to place relationship file. Downloaded 2026-10-11.
- San Antonio Board of REALTORS, San Antonio area market report, September 2026 press release dated October 9, 2026. Downloaded 2026-10-11.
Where these figures come from
| Asking prices | Active listings, all property types, ZIP Codes 78108, 78148, 78154 and 78233. Data through September 2026; retrieved 2026-10-11. Year-over-year changes are our arithmetic on the September 2025 and September 2026 rows of the same file. |
|---|---|
| Owner value bands | Owner-occupied housing units, city limits, ACS 2020–2024. Bands combine the published categories; margins of error for combined counts and shares follow the Census Bureau's approximation formulas. Retrieved 2026-10-11. |
| Closed sales | San Antonio area and Bexar County only, September 2026, as published by SABOR. Retrieved 2026-10-11. |
| Not yet documented | September 2026 closed-sale counts and medians for the cities of Universal City, Schertz, Cibolo and Live Oak; a split of any figure between new construction and resale. |
| Published | 2026-10-12 |
| Data retrieved | 2026-10-11 |
| Next review | By 2026-11-11, or when Realtor.com publishes its October 2026 file, whichever comes first. The asking-price tables are historical after that date until refreshed. |
This article is general market information, not an appraisal, a valuation of any property, or a forecast. It is not legal, tax, or financial advice. Figures come from the sources named above and describe the periods stated; confirm current conditions for a specific property before making a decision.
Velvet Realty Group is brokered by LPT Realty, LLC. Equal Housing Opportunity.
Get the closed sales behind these bands.
Tell us the city, the price range and the home size you are weighing. We will send a dated brief with recent closed sales from the MLS, active competition and pace for that slice of the corridor.