
Velvet Realty Group Blog
Universal City Housing Snapshot: Inventory and Price Bands
In July 2026, ZIP 78148 carried 95 active listings, the most in a record that starts in July 2016, while the median asking price fell to $274,975. Here is what those two numbers are, side by side with the four ZIP Codes around them, and what they cannot tell you.
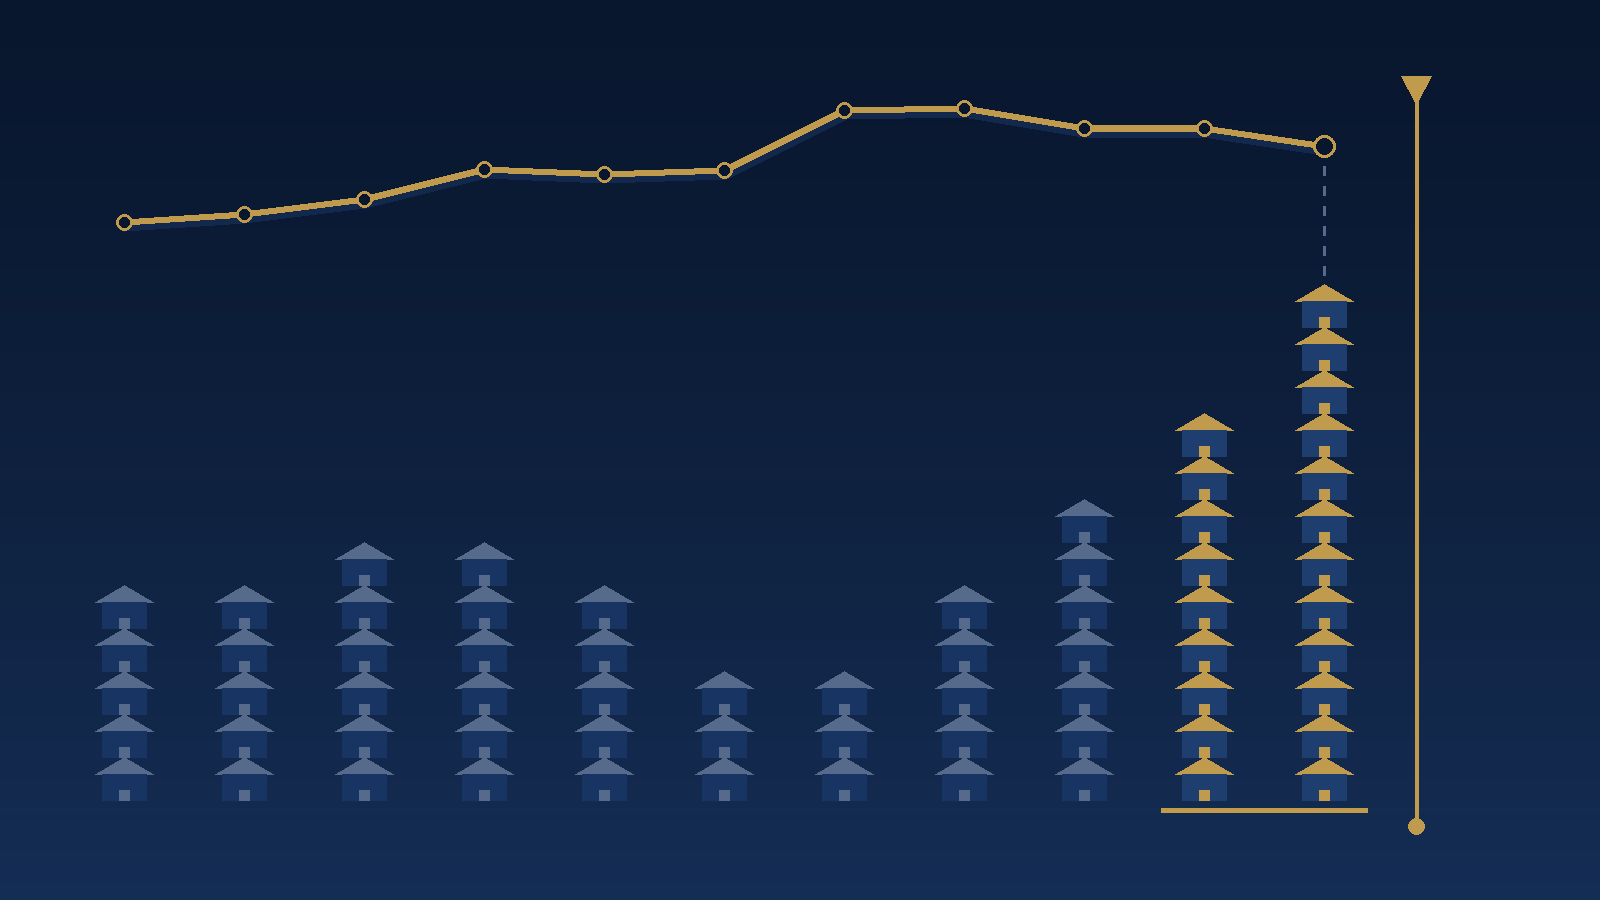
The short version. Universal City's ZIP had 95 homes listed for sale in July 2026 and 22 under contract. A year earlier it had 71 listed and the same 22 under contract. The median asking price fell from $295,000 to $274,975. The published median days on market read 63 in both Julys.
The two numbers that moved
Almost everything interesting in this month's data comes from one gap: listings went up sharply and contracts did not follow.
Active listings in 78148 rose from 71 to 95 between July 2025 and July 2026, a 33.8% increase. That is the highest count in any month of the series, which begins in July 2016. New listings coming to market in July doubled, from 16 to 32. Meanwhile the number of homes under contract was 22 in both years, unchanged.
The median asking price moved the other way, from $295,000 to $274,975, down 6.8%. Two other medians moved with it. The median listed home was smaller, 1,892 square feet against 1,931, and the median asking price per square foot went from $155 to $146, down 5.8%. Each of those three is a separately calculated summary metric published for this ZIP Code and this month. The file does not say what population each one is measured over, so read them side by side: none of them explains or breaks down into the others.
| Measure | July 2025 | July 2026 | Change |
|---|---|---|---|
| Median list price | $295,000 | $274,975 | −6.8% |
| Median list price per square foot | $155 | $146 | −5.8% |
| Median listing size | 1,931 sq ft | 1,892 sq ft | −39 sq ft |
| Active listings | 71 | 95 | +33.8% |
| New listings that month | 16 | 32 | +16 |
| Listings under contract | 22 | 22 | no change |
| Pending ratio (pending ÷ active) | 0.30 | 0.23 | −0.07 |
| Median days on market | 63 | 63 | no change |
| Price-reduced listing count | 42 | 60 | +18 |
| Price-reduced share | 40.5% | 41.4% | +0.9 points |
| Total listing count (separate source field) | 93 | 118 | +25 |
Three of these rows need a word about how they are published. The count and the share of price-reduced listings are separately published fields in the source file. The share is not the count divided by the active listings above it, and the file does not state which population it is measured against, so both are printed here as published rather than folded together.
The last row is a third separately published field, total_listing_count, read out of the same monthly row as everything else in this table. It is not the two count rows above it added together: the file's July 2026 row carries 95 active, 22 under contract, and a total of 118. The file does not state how that total relates to its own active and pending counts, so this page prints the published total and leaves it at that. Do not reconstruct this row by adding the active and pending rows.
The days-on-market row is the one people misread. The published median read 63 in both Julys. That is a single summary value for each month: it does not describe every listing, it says nothing about how long any particular home was available, and it is not proof that marketing time held steady. The counts are the part of this table that moved.
Where the asking band sits against the corridor
A single ZIP in isolation is not much use. The four ZIP Codes a Universal City buyer usually looks at alongside it are Schertz, Cibolo, Converse, and the northeast San Antonio ZIP that runs down toward Loop 410.
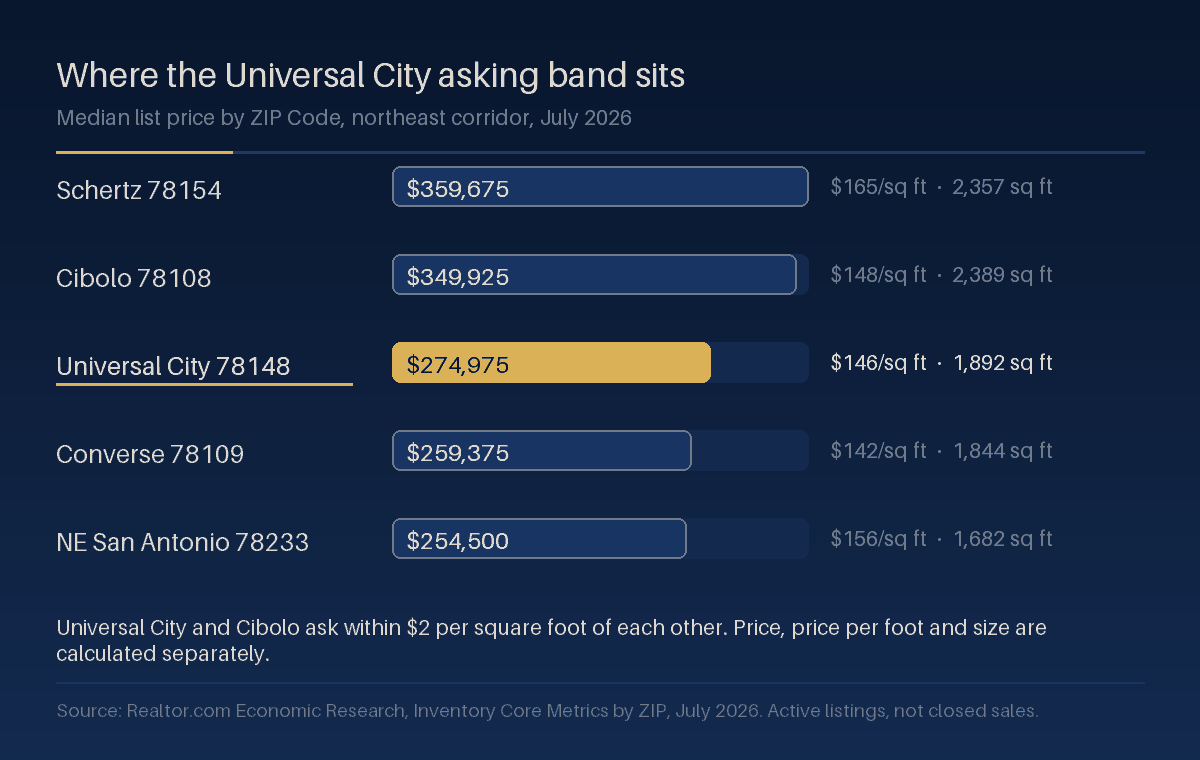
| ZIP Code | Median list price | Per square foot | Median size | Active listings | Change in active vs July 2025 |
|---|---|---|---|---|---|
| Schertz 78154 | $359,675 | $165 | 2,357 sq ft | 222 | no change |
| Cibolo 78108 | $349,925 | $148 | 2,389 sq ft | 343 | +6.9% |
| Universal City 78148 | $274,975 | $146 | 1,892 sq ft | 95 | +33.8% |
| Converse 78109 | $259,375 | $142 | 1,844 sq ft | 516 | +13.9% |
| Northeast San Antonio 78233 | $254,500 | $156 | 1,682 sq ft | 194 | +4.3% |
Read the per-square-foot column and the ordering changes. By headline price, Universal City sits third of five. By price per square foot it sits fourth, below northeast San Antonio, which asks $156 a foot for homes that are 210 square feet smaller at the median. Universal City's median listing is also smaller than Schertz's and Cibolo's. Price, price per foot, and size are three separately calculated summary metrics published for the same geography and month, so read all three side by side rather than treating one as the reason for another.
Universal City's 33.8% jump in active listings is also the largest of the five, by a wide margin. Schertz was flat. That is worth knowing before you treat any corridor-wide statement about "the northeast side" as applying evenly.
How much of the inventory is moving
Counting listings tells you what is available. It does not tell you how much of it is being absorbed. The pending ratio does: it divides homes under contract by homes still for sale.
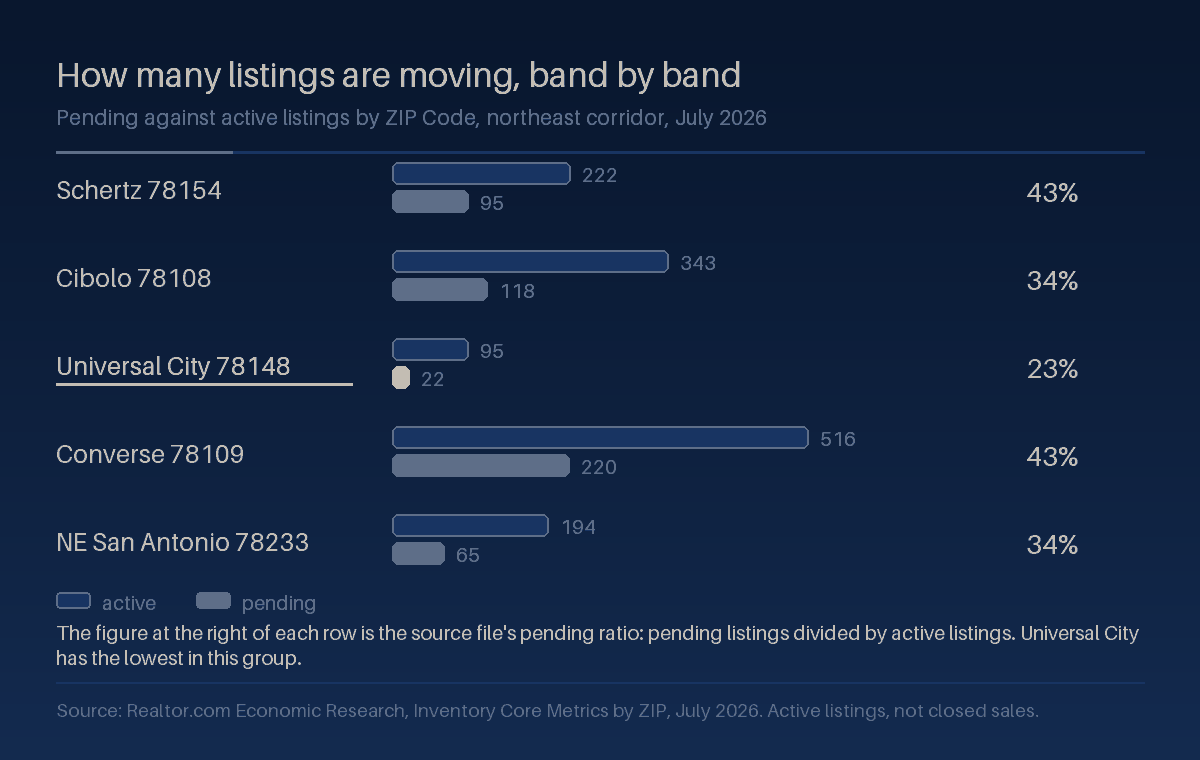
Universal City's ratio was 0.23 in July 2026, down from 0.30 a year earlier. Schertz and Converse were both near 0.43. Converse carries 516 active listings, far more than Universal City, and is still turning a larger share of them into contracts.
For scale, July 2021 in the same ZIP looked like this: 21 active listings, 44 under contract, a pending ratio of 2.10, a median of 30 days on market, and price cuts on 10.1% of listings. There were two homes under contract for every one available. Five years later there is roughly one under contract for every four available. Neither July is ordinary, and neither is this ZIP's extreme: across the 121 months since July 2016 the pending ratio has run as high as 4.75, in April 2021, and as low as 0.18, in December 2024.
What this snapshot is not
These are asking prices on listings, not sale prices on closings. A median list price is what sellers are asking as a group. It is not an estimate of what any home sold for, and it is not a valuation of your home.
A ZIP Code is a mail delivery area, not a city boundary. ZIP 78148 and the City of Universal City overlap heavily but they are not the same shape, and a home inside the ZIP may sit in a different city, school district, or taxing jurisdiction. Confirm boundaries at the address level rather than by ZIP.
A median summarizes a month of a market that is not the same from one month to the next. When what is on the market shifts toward smaller or older homes, a median moves even if no individual seller changed a price. That is why the per-square-foot column is in the table next to the headline figure. Each median in these tables is computed on its own, so a move in one cannot be divided into contributions from the others.
Median days on market is the same kind of figure: one value for a month, not a statement about how long any particular listing was available. An identical reading in two Julys is not evidence about individual marketing time.
One month is one month. The 2016 to 2026 series in the illustration is there because a single reading, in either direction, is not a trend.
What it changes, depending on which side you are on
If you are buying, the useful shift is not the price. It is that 95 homes were competing for the same buyers instead of 71, and that the file's price-reduced count for the month rose from 42 to 60. That is a different negotiating position than 2021, and it is a reason to be specific about condition, age, and what a given seller has already conceded. The due diligence checklist for buying near JBSA Randolph covers what to verify on a particular address once you are past the market-level question.
If you are selling, the number that matters is not the median either. It is that your home is one of 95, and that the ones nearest yours in size, age, and condition are the comparison a buyer will actually make. Corridor averages are the wrong yardstick when there is this much on the market. Our pre-listing repair checklist for Universal City and Schertz covers the preparation side, and a pricing conversation should be built on the closest competing listings rather than a ZIP-wide figure.
We do not publish forecasts. We publish what the source said, on the date it said it, and then look at your address.
Where the data comes from
Every figure on this page comes from one file: Realtor.com's Inventory Core Metrics by ZIP Code history file, published through Realtor.com Economic Research. We downloaded the file directly and read the rows for the five ZIP Codes shown, rather than transcribing figures from a summary page. The counts, prices and sizes in the tables above are the values that file publishes.
One methodological note, because it is the kind of thing that looks like an error later. Each change column above is arithmetic we performed on the two values printed beside it, so a reader can check it against the figures on the page. The source file also publishes its own year-over-year fields, computed before the medians are rounded to whole dollars; those land within a point of every figure shown here, and where the two differ the arithmetic on the printed values is what we used. The one exception is the pending ratio, which is the file's own pending_ratio field rather than a division we performed, and it is the one row we display rounded: this page shows the pending ratio to two decimal places while the source file carries more precision, so July 2026 reads 0.2316 in the file and prints as 0.23 here, and July 2021 reads 2.0952 and prints as 2.10. The full precision stays in the linked source file and in this page's provenance record; the change beside those rows is the subtraction of the two displayed readings.
| Metric definitions | Realtor.com Inventory Core Metrics: median list price, median list price per square foot, median square feet, active listing count, new listing count, pending listing count, pending ratio, median days on market, price reduced count and share. |
|---|---|
| Exact geography | ZIP Codes 78148, 78154, 78108, 78109, and 78233. Not city limits, not school district boundaries, not neighborhoods. |
| Data through | July 2026 (month ending 2026-07-31), with the July series running back to July 2016. |
| Source file published | 2026-08-04 |
| Retrieved and verified | 2026-08-25 |
| Published | 2026-08-26 |
| Last reviewed | 2026-08-26 |
| Next review due | 2026-09-04, when Realtor.com is expected to publish the August 2026 month. The July file went up on August 4. These figures expire then and should be re-sourced before reuse. |
| Corrections | If a figure on this page does not match the source file, tell us and we will correct the page, restate the corrected figure, and update the review date above. |
Sources
- Realtor.com Economic Research, Real Estate Data Library, the publisher's data page for the inventory core metrics series, including metric definitions. Retrieved 2026-08-25.
- RDC Inventory Core Metrics, ZIP Code history file (CSV). The file itself, from which every figure on this page was read. File last modified 2026-08-04; downloaded and read 2026-08-25.
Realtor.com data is a residential listing-based series and reflects the listings on that platform for the month shown. It is not a multiple listing service closed-sales report, and it does not describe any individual property. Every metric on this page was transcribed from that file rather than restated from a summary, and the one figure shown at reduced precision is the pending ratio, noted above.
Related Universal City guides
For the area itself rather than the numbers, start with living in Universal City: homes, ZIPs, and commute anchors, which explains why the ZIP and the city limits are different shapes and what sits inside each. The Universal City service area hub links the rest, and the Universal City core and Pat Booker Road area guide goes street by street through the older part of the housing stock these medians are mostly made of.
For the wider picture, the market update page carries the San Antonio figures from the San Antonio Board of Realtors, which are closed sales rather than listings and answer a different question. If you are weighing the corridor as a whole, Schertz, Cibolo, and Converse each have their own hub.
Ask for the version with your address in it
A ZIP-level median is a starting point and not an answer. If you want the same treatment for a specific home, a specific street, or a price band you are actually shopping, we will pull it, date it, cite it, and walk through it with you. Nothing on this page is an appraisal, a valuation, or a promise about what any home will sell for.
Get a dated snapshot for your address.
Tell us the street, the size, and the timeframe, and we will send the current numbers with their source and date attached.